Using GDB for Debugging Git
I always use print() statements for debugging my code and projects. It is also known as The Caveman Debugger. I got to know about this term in my freshman year when one of my mentors told me about this method of debugging while working on some feature in an open source project, in which you can put some print statements in the codebase like print("********PRINT IS COMING HERE***********"); and check the logs for print statements. This worked for me up until this time, but I have always wanted to learn to use a debugger and I did so the last week 🤓
While debugging the git codebase and implementing the feature, I faced a memory leak where a buffer was not freed when the caller of the function is returned. My mentor suggested to me to use gdb, and that’s when I knew I should dig in and learn a bit! I googled it and came across some amazing documentation and video lectures, which really helped me a lot to learn about it and how to debug using it. I thought of sharing my experience with a wider community, so here I am with the blog!
We need to first set up our git project for debugging. Following two steps are necessary and will help in getting the most out of our debugging!
Disabling compiler optimizations
First, we should know that compilers optimize our code. With optimizations enabled, compilers can wipe out symbol information and make it difficult to inspect the code. If you check git’s Makefile, you will find that by default, git gets compiled with -O2 optimization level. As per gcc’s documentation, -O2 optimization level produces highly optimized code and has the slowest compile time.
When debugging something, we generally want unoptimized code. We basically want the compiler to compile the source code in the most straightforward way possible, that is, each command in the source code should be converted directly to the corresponding instructions in the executable file without any rearrangements.
Enabling debug symbols
There are certain debug symbols and print statements which are compiled only when the project is compiled with debug flags enabled. While debugging, those can be of great help!
So, to set up the git project for debugging, create a config.mak file in the root of your git’s source code. Following should be the contents of that file:
1 | DEVELOPER=1 |
Then just compile and install the git project using the following commands:
1 | $ make configure |
Now lets fire up our debugger, gdb, and debug the shit out of the git codebase! 😤
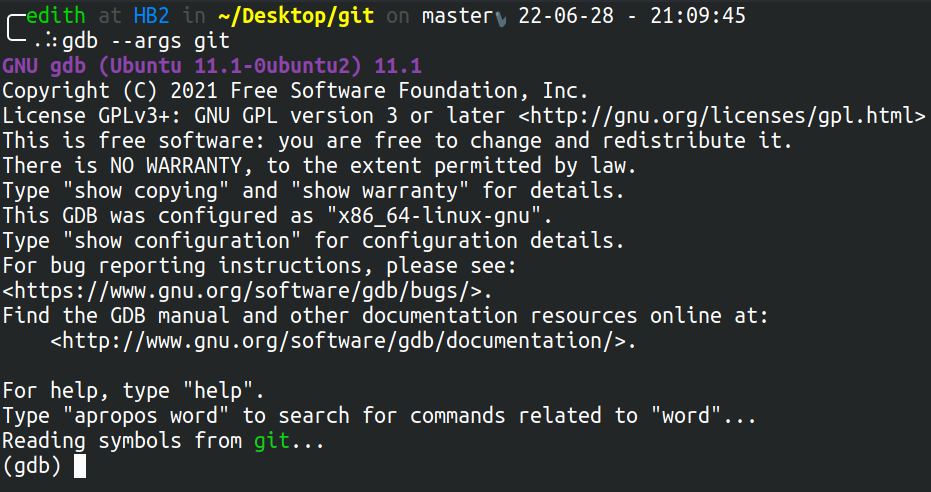
gdb takes the name of the executable that we want to debug, in our case, it happens to be git
So let’s start the debugger using gdb --args git, and you will see something like following:
Let’s assume we want to understand what is happening in function replace_commit_idents_using_mailmap function:
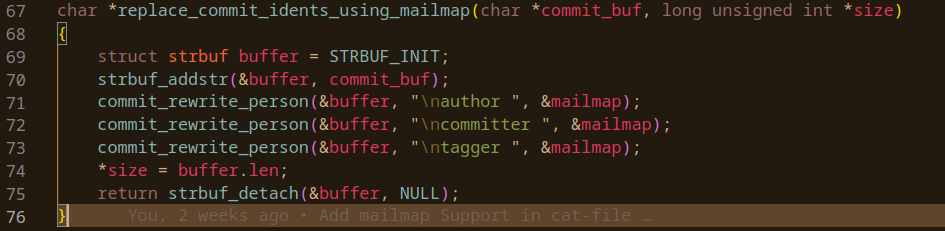
Wouldn’t it be great if while execution the control stops before the above function starts execution, giving us the opportunity to inspect variables, addresses, memory and a lot of other things! We can totally do that by setting up a breakpoint. To set a breakpoint in a function, we can use break <address of file>:<line number>.
So I created a breakpoint in builtin/cat-file.c:69 at the first line of replace_commit_idents_using_mailmap function, by executing break builtin/cat-file.c:69
Now that we have set up the break point, we now have to execute the program so that the above function gets called. In our case, this function gets called when we use the following command:
git cat-file --use-mailmap commit HEAD
You will now observe that the execution stops at the line 69, and you can inspect whatever you want!
Following are some important gdb that I happened to use a lot while debugging:
- Refresh the display:
refreshorControl-L - Run your program:
run - See your code:
layout next - Set the breakpoint:
break POINTcan be function name, line number etc. - next line:
nextornfor short - Continue (to next break point):
continueorEnter - print a variable’s value:
print <variable> - print an array:
print *arr@len - watch a variable for changes:
watch <variable>
By default, when you start you will see a normal terminal and whenever you might want to check where you are in the code you will have to execute list command. I ended up losing track of where I was in the program countless times, on googling a bit, I came across layout next command which we can use to actually see the code being debugged line by line in a split terminal, the assembly of the line where we are currently in the code and the gdb terminal. Following screenshot shows that:
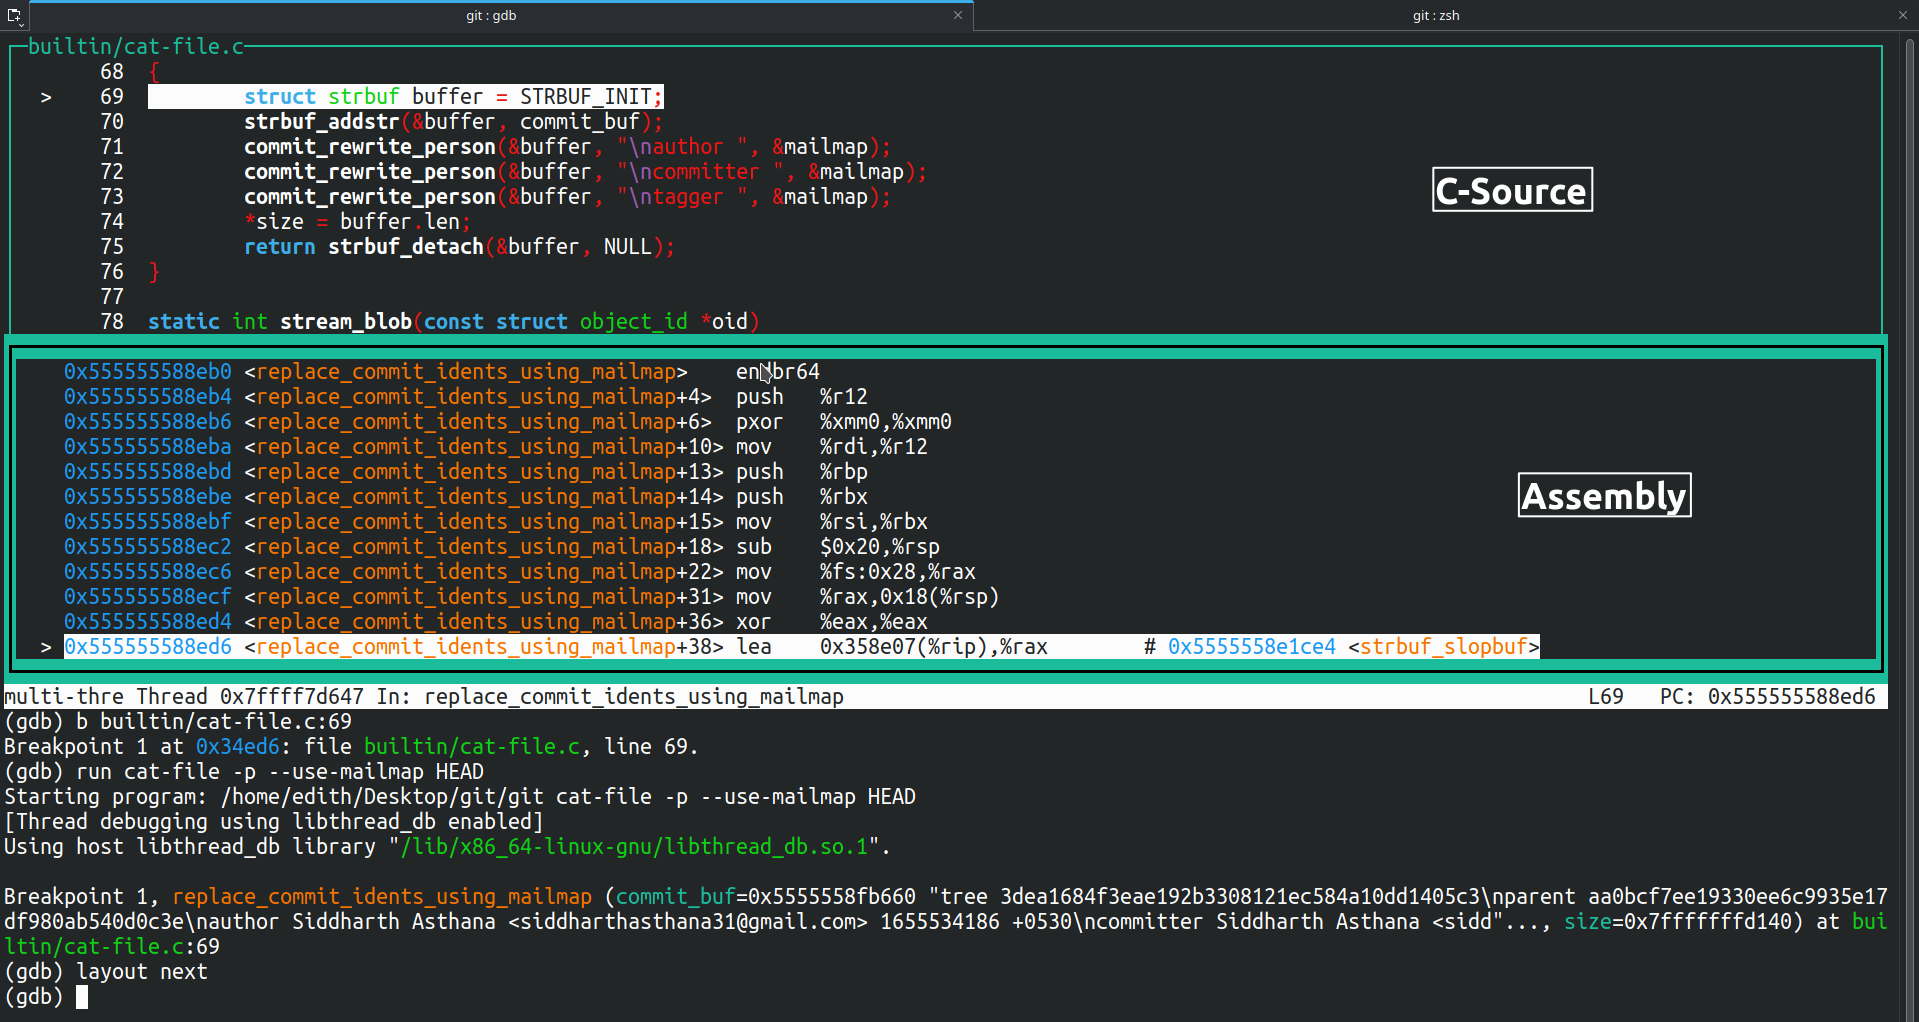
As you can see, by enabling the Text User Interface (TUI) in gdb we can easily see our source code and the assembly which make our work easier.
References
- https://github.com/git-for-windows/git/wiki/Debugging-Git — talking about debugging git using gdb
- https://undo.io/resources/gdb-watchpoint/5-ways-reduce-debugging-hours/ — refer to unleash the power of the TUI mode I have shown above… this is highly recommended!
- https://www.chciken.com/assets/gdb_cheat_sheet/gdb_cheat_sheet_dark.pdf — a very handy cheat sheet
- https://www.youtube.com/watch?v=bWH-nL7v5F4&t=1071s
- https://www.youtube.com/watch?v=PorfLSr3DDI — highly recommended!!!
I hope this helps a bit! Thanks a lot for reading 🙂